Events and Resources: Hanami and more at the Brooklyn Botanic Garden

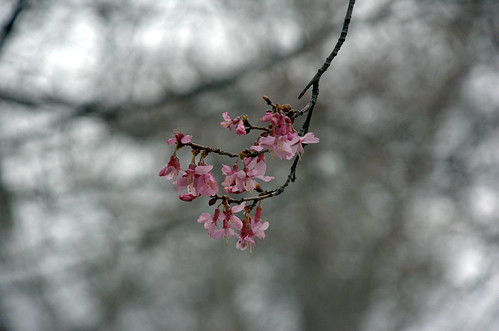
Flower Detail, Prunus “Okame”
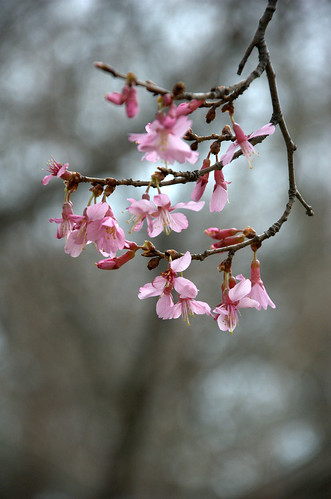
Cherry Blossoms

Gowanus Lounge noted an article on New Yorkology about the first cherry tree to bloom this Spring at the Brooklyn Botanic Garden, more than a week before Hanami, the cherry-viewing season, officially begins this weekend. I saw that tree in bloom when I visited on Forsythia Day. I didn’t get to write up that visit yet; the least I can do is pump up this tree’s 15 minutes of fame. (It’s not as impressive as the cherry tree which bloomed in December, which I didn’t get to see.)

Before you visit the Brooklyn Botanic Garden, you should visit their Web site. Their Plants in Bloom page shows you what happens where and when: not just right now, but for every month of the year. Some areas are of particular interest only at certain times of the year, and knowing whether or not they’re worth a peek in advance of your trip can help you plan your visit. For example, Daffodil Hill was not quite peaking when I was there on Sunday, while the Bluebell Wood was showing only winter-damaged foliage. Of course, much of the garden has lots of things even when they’re not in bloom, but this still is a good indicator of what you might expect to see.

But this time of year, the hype is all about the Cherry Trees. Hanami runs from this Saturday, April 7, through Sunday, May 6. The big event is the annual Sakura Matsuri, the Cherry Blossom Festival. This year it’s the end of April, Saturday and Sunday, April 28 and 29. There’s always an impossible number of events highlighting many different aspects of traditional Japanese culture, including music, dance, theater, crafts, and more.

Leading up to and during Hanami, BBG maintains a special map on their Web site, just for the cherries.

BBG’s CherryWatch (Hanami) Blossom Status Map showing the single specimen of Prunus “Okame” in bloom at the time of my visit.
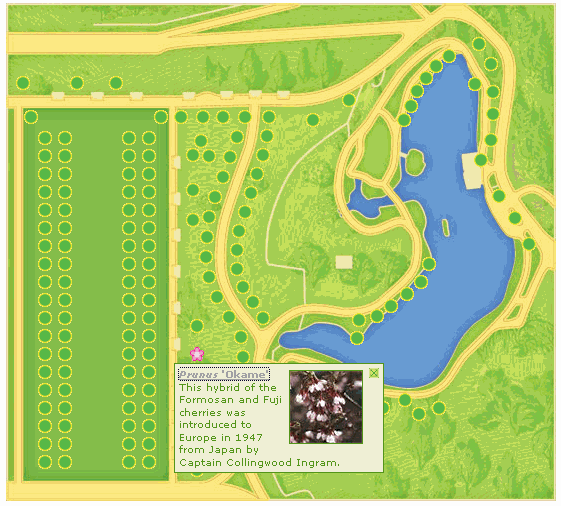
Blossom Status Map, Brooklyn Botanic Garden

Each cherry tree on the map is linked to a popup summary of the plant, as shown here, which links to a detail page describing the specific variety. Here’s what BBG has to say about ‘Okame’:

This hybrid of the Formosan and Fuji cherries was introduced to Europe in 1947 from Japan by Captain Collingwood Ingram. Its deep carmine-rose buds open to lighter tinted flowers before leaves appear. This small- to medium-sized tree is excellent for small gardens and is also showy in fall, with orange-red leaves. This variety is recommended by the Garden Club of America’s book, Plants That Merit Attention.
Prunus ‘Okame’

And here it is: the single flowering cherry tree.

Lone Flowering Cherry and my Doppelganger
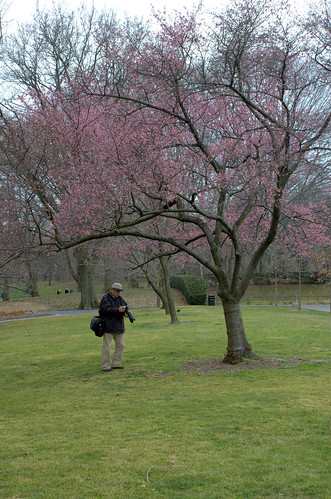

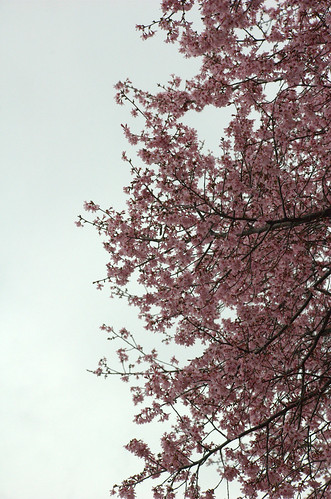
The other photographer in the photo seemed to be everywhere I was on Sunday, so I had to shoot around him a lot. For example, he was standing next to me (or I next to him) when I took this upward-looking shot against the overcast sky:

Cherry Blossoms

Finally, here’s a different shot of the same cluster of flowers at the top of this post. I like the background of the out-of-focus branches in this one; it works like an oversized mat in a picture frame. I think I’m going to process this one a bit and try to lighten it up without losing the mood.

Cherry Blossoms

Links

Flowering Cherries at BBG

Ruby-Throated Hummingbirds are migrating north

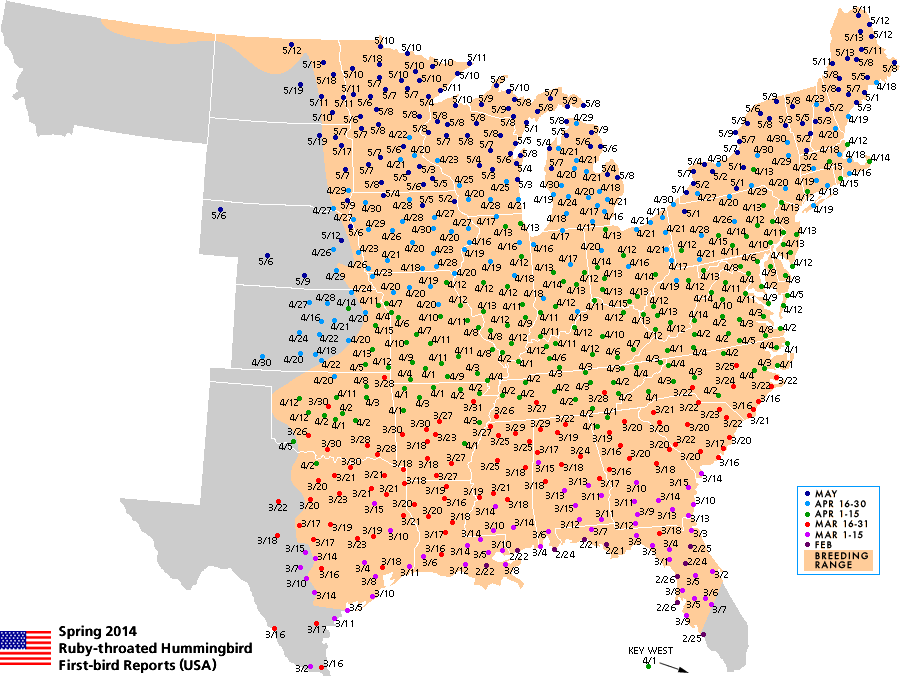
Ruby-Throated Hummingbird Sightings and vegetation.
Credit: NASA Earth Observatory

Okay, NASA does have some pretty powerful satellites, but they can’t identify hummingbirds from space just yet.

Every year in March, the first ruby-throated hummingbirds arrive in Gulf Coast states from their wintering grounds in Central America. Fattened on insects, the tiny birds fly 500 miles across the Gulf of Mexico and arrive in the United States hungry for nectar from early spring flowers. As spring progresses into summer, the birds follow maturing vegetation northward into the eastern United States and Canada. During this journey north, students across the country track the birds’ progress. When a student sees a bird, he or she records the sighting. Teachers report their students’ sightings to the Journey North web page, where it is logged on a map. At the end of the week, Journey North staff members review the sightings and publish a weekly summary.

The dots on this image mark student sightings of the first adult ruby-throated hummingbirds of the spring 2007 migration. White dots indicate confirmed sightings prior to March 15, while the purple dots show sightings reported (but not yet confirmed) between March 15 and March 19. The earlier sightings are along the southern coast, where the birds first come ashore after crossing the Gulf. The northernmost sightings are the most recent records. The birds are clearly concentrated in the areas that have started to green up, where nectar-laden flowers would be available. New vegetation is only beginning to reach the northern section of the image, and as a consequence, the birds have yet to migrate to those areas.

On her blog Burning Silo, Bev Wigney noted on March 16, an equivalent effort, the Hummingbird Migration Project:

As of today, both efforts have recorded sightings as far north as South Carolina on the Atlantic seaboard, and far western Tennessee along the Mississippi. By the end of the summer, Ruby-Throated Hummingbirds will make their way to New York City and Long Island. My trumpet honeysuckle and scarlet runner beans will be waiting for them.

Landscape and Politics in Brooklyn’s City Council District 40

Brooklyn City Council District 40Next week, on Tuesday, February 20, there will be a special election to replace Yvette Clarke as Brooklyn’s 40th District City Council Member. Clarke was elected to Congress in last year’s elections. The council member elected on February 20 will serve only until the end of 2007. A general election in November will elect the member to serve the remainder of Clarke’s unfinished term.

Last week I attended a Candidates’ Forum on Preservation and Development. The Historic Districts Council, a sponsor of the Forum, has issued a Preservation Voter Guide.

There are several landmarked historic districts within District 40, and hopefully another soon. Still, most of the Victorian Flatbush neighborhoods are at risk of being lost forever due to inappropriate zoning and development.

NYC asks us to imagine What kind of city we want to live in by 2030. What happens to this area in the next decade will determine not only what happens by 2030, but this century and beyond. The neighborhoods of Victorian Flatbush are not only worth preserving, it’s critical to the future of this area that we do so. It’s not just about pretty houses, or property values. It’s about open space and shade. It’s about the rates of asthma and respiratory disorders. It’s about moderating surface temperatures by preserving and managing the urban forest, reducing heating and cooling demands. It’s about how many people will die in the heat waves we will experience by the end of the century. It’s about the quality of life for the entire area, and whether or not it will be livable in the future.


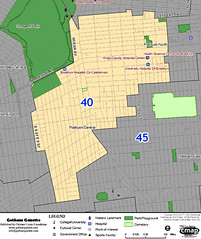
This map shows the locations of schools and parks in City Council District 40. Schools are indicated with blue dots. The green labels identify the location of parks. Open space, including cemeteries, ball fields, and so on, are outlined in green. Prospect Park abuts District 40 on the northwest. The Parade Ground south of that is ballfields. Other than that, there is a near complete absence of parks within District 40.

Brooklyn City Council District 40: Schools and Parks

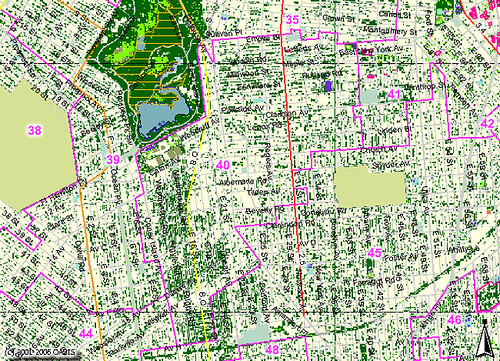
This map shows landcover classification in District 40. Dark green areas are trees and forest. Light green areas are grassland, fields and such. Everything else is classified “impervious”, ie: buildings, streets, sidewalks, pavement, etc.

Brooklyn City Council District 40: Classified Landcover

South of Prospect Park, note the interrupted band of dark green that extends to the south boundary of the District. These trees provide the only greenery and shelter in District 40. This area is the lungs of Flatbush.

Now we zoom in on my little neck of the woods, the Victorian Flatbush neighborhood of Beverly Square West. This map shows the outlines of buildings and the landcover classification. At this scale, it becomes clear that it is the trees on private property, not street trees, and certainly not parks or “open areas”, that provide most of the tree cover.

Beverly Square West: Buildings and Classified Landcover

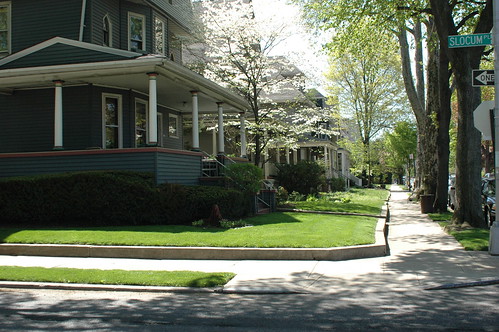
And this is what it looks like from the ground. These two photos show the view from the same street corner on my block, as it looks in Spring and Fall.

DSC_0498
Stratford Road, East side, looking South from the corner of Slocum Place

With no parks for blocks around, and few playgrounds, it’s no wonder that parents come to our streets to stroll their babies and walk their children. It’s the only green space within walking distance for many people.

Links:

News, August 1, 2006: NASA Earth Observatory Maps NYC’s Heat Island, Block by Block

Timely enough, given the record temperatures we’re experiencing this week. Tomorrow’s forecast has been “upgraded” from what I reported yesterday: the THI may reach 117F tomorrow.

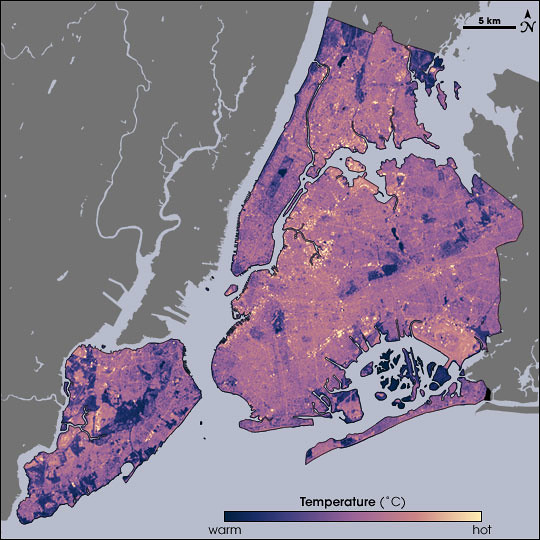
Temperatures in New York City as measured by Landsat on August 14, 2002, at 10:30am, during a heat wave. Cooler temperatures are blue, hotter are yellow.
Source: NASA Earth Observatory. Map by Robert Simmon, using data from the Landsat Program.
NASA Map of Surface Temperatures in New York City, 2002-08-14

Temperatures in New York City as measured by Landsat on August 14, 2002, at 10:30am, during a heat wave. Cooler temperatures are blue, hotter are yellow.
Source: NASA Earth Observatory. Map by Robert Simmon, using data from the Landsat Program.
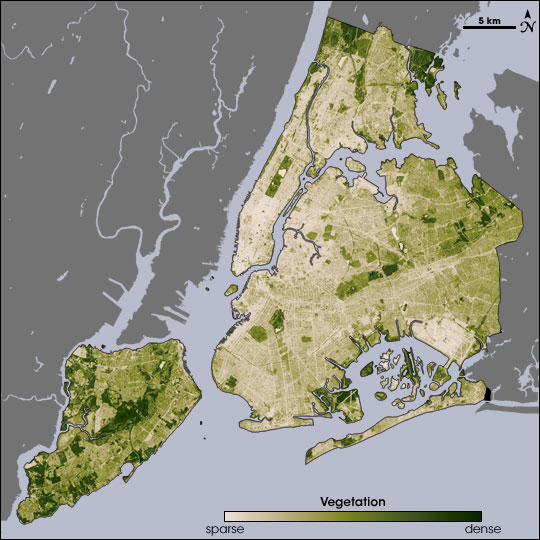
NASA Map of Surface Vegetation in New York City

The ability of vegetation to moderate urban temperatures is graphically demonstrated in these paired images from NASA’s Earth Observatory. The spatial resolution of these images is 60 meters per pixel. At that scale, I can just about make out the block where I garden:

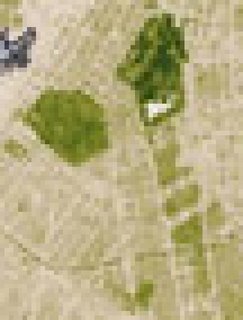
Closeup of the vegetation map, centered on central Brooklyn. The green area at the left is Greenwood Cemetery. Prospect Park is the dark green area at the top; the white area within it is Prospect Lake.

Below the park, to the south, Victorian Flatbush, with its tree-lined streets, detached wood frame houses, and front lawns, spreads out as a series of olive green areas. The beige areas in-between the olive are rowhouses and apartment buildings. You can even make out a curving green line across the southern end of this area: That’s the old LIRR right-of-way, long abandoned, and overgrown with trees.

NASA has just published a report on urban heat islands highlighting the research of Stuart Gaffin, an associate research scientist with the Earth Institute at Columbia University in New York City, and his colleagues:

In the summer of 2002, Gaffin and his colleagues used satellite temperature data, city-wide land cover maps, and weather data, along with a regional climate model to identify the best strategies for cooling the city. The team estimated how much cooling the city could achieve by planting trees, replacing dark surfaces with lighter ones, and installing vegetation-covered “green roofs.”
The team studied the city as a whole, as well as six “hotspot” areas—including parts of Manhattan, the Bronx, Queens, and Brooklyn—where air temperatures near the ground were higher than the city-wide average. Each area was serviced by Con Edison, the local power company, so the scientists could compare electricity use. Each area also had available space so that the mitigation strategies the team considered could be modeled in the study and potentially implemented later on.
August 14 fell on one of the hottest heat wave days in New York’s summer of 2002, making it a good day to take the city’s temperature. Measuring the temperature of every last sidewalk, street, parking lot, roof, garden, and grassy area in an entire city isn’t easily done from the ground, so the researchers relied on NASA to take the city’s temperature from the sky. NASA’s Landsat Enhanced Thematic Mapper collected thermal infrared satellite data. …
Beating the Heat in the World’s Big Cities

Related posts

Urban Forestry