The OASIS Mapping Service

Welcome, OASIS visitors! In addition to this tutorial, you can see some other examples of OASIS maps elsewhere on this blog:

Flatbush Rezoning Proposal will define the future of Victorian Flatbush, 2008-06-13
Weather Alert: Flood Watch Tonight and Tomorrow, 2008-03-04
Imagine Flatbush 2030, 2007-11-20
The Future Home of the Ex-Lax Gardens, 2007-11-01


In NYC, the non-profit OASIS – New York City Open Accessible Space Information System Cooperative – provides a thematic mapping service on their Web site. I have a link to them in the sidebar of my blog under “Links > NYC”. They consolidate multiple sources of public information. In addition to all the real estate related information, they have layers for groundcover classification, street trees, aerial maps, flood hazards, and so on.

I’ve been using it for the past three and a half years. I’ve used it to generate many of the maps in my blog posts to visualize different themes and issues. I’ve become very comfortable using it.

The Kensington (Brooklyn) blog notes that it “seems to have a ton of info though we can’t seem to figure it out.” They mention a couple of empty lots, including one on Caton Avenue which caught my eye when I passed it on my way to visit their East 4th Street Community Garden this past Saturday. I’ll use that empty lot as an example. What follows is a step by step tutorial on how to use the OASIS Mapping Service to get information about your neighborhood, and get details about a particular piece of property.

1. Select a Theme

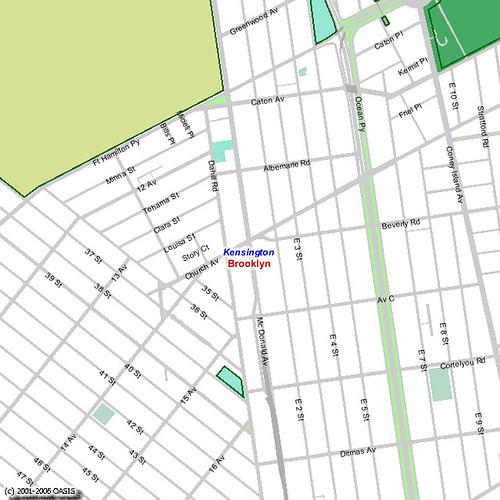
An easy way to get started using it is to use the “Search By” drop-down box at the top of the page to select the topic of interest. For this tutorial, select “Neighborhood” for “Search By”, then select “Kensington” for “Neighborhood.” That gets you into the general area. Your map should look like this.

Default OASIS Neighborhood Map for Kensington, Brooklyn

2. Choose your Layers

Note the right-hand column, labeled “New Layers”.

New Layers

Here you can control what is, and isn’t, displayed on the map. The “Layer” checkboxes on the left control points, lines and borders, and areas. The “Label” checkboxes on the right control text labels, like “Brooklyn” and “Kensington” in the map above.

Let’s get rid of “Brooklyn”; we know that’s where we are! Look for the section labeled “Boundaries & Labels” and uncheck the “County/Borough” box.

Boundaries & Labels

Legend imageTown/Neighborhood
Legend imageCounty / Borough
Legend imageCommunity Districts
Legend imageCity Council Districts

Let’s see the subway lines and stations, and let’s also see the station names.

Transportation

Legend imageStreets
Legend imageBridges / Overpasses
zoom in/out Highways / Major Roads
Legend imageSubway Stations
Legend imageSubway Routes
Legend imageFerry Stops
Legend imageFerry Routes

3. Redraw the map

Whenever you change the layers, you need to click the “Redraw Map” button at the top or bottom of the page for your changes to take effect. With our layer changes above, our new map looks like this.

OASIS Neighborhood Map for Kensington With Subway Layers

4. Refine your Layers

We said we were interested in vacant lots, so let’s turn on that layer so we can see where they are. It’s the last layer listed in the “Property & Land Use” section. Check the box for that, then redraw.

Property & Land Use

zoom in/out Block/Lot Boundaries
zoom in/out Buildings
Legend imagePiers
Legend imageNYCHA Properties
Legend imageSchools
Legend imageHistoric Houses
Legend image1 & 2 Family Residential
Legend imageMulti-family Residential
Legend imageMixed Use
Legend imageCommercial
Legend imageInstitutions
Legend imageTransportation & Parking
Legend imageIndustrial
Legend imageVacant Lots

OASIS Neighborhood Map for Kensington with Vacant Lots

5. Zoom in

Notice that the first two layers in the Property & Land Use section – Block/Lot Boundaries and Buildings – are disabled: they have no check boxes. Instead, there’s a hint: zoom in/out. We can’t view those layers at this scale. We need to zoom in.

Notice the row of buttons across the top of the map.

Identify Identify Zoom In Zoom In Zoom Out Zoom Out Pan Recenter Tag map Help

The “Zoom In” button is enabled. If we click on the map, we zoom into it, centered on the location where we clicked.

Our large vacant lot on Caton is in the upper right of the map, one block east of Ocean Parkway and west of the Parade Grounds. Click on it to zoom in on it. Your map should look something like this, depending on exactly where you clicked.

Map of Vacant Lot on Caton Avenue in Kensington

Now we can see the lot boundaries. We could zoom in closer, but this is a large lot, and it’s big enough for us to select for identification.

6. Identify

At the top of the map, click the Identify button to enable it.

Identify Identify Zoom In Zoom In Zoom Out Zoom Out Pan Recenter Tag map Help

Now, whatever you click on in the map will be identified with detailed information in the area below the map. Click the vacant lot. The map changes to highlight the selected lot with a red border.

701 Caton Avenue, Kensington, Brooklyn

Scroll down to the area below the map to see all the details for this property.

Information about the Lot you identified:

Borough: Brooklyn Block: 5321 Lot: 64 Police Precinct: 72
Address, ZIP Code: 701 CATON AVENUE, 11218
Lot Area: 29210 sq. feet Lot Frontage: 248.17 feet Lot Depth: 100 feet
Number of buildings: 0 Year built: 0
Number of floors: 0 Building Gross Area: 0 sq. feet
Residential Units: 0 Total # of Units: 0
Landuse: Vacant Land
Zoning: R6: Residential
Commercial Overlay: Zoning Map #: 22C
(PDF version of most recent City Planning zoning map & proposed zoning changes for this area.)
Floor Area Ratio: 0 Max. Allowable Floor Area Ratio: 2.43
(FAR may depend on street widths or other characteristics. Contact City Planning Dept. for latest information.)
Owner: 701 CATON AVE REALTY,
More building information: NYC Dept. of Buildings
More property information: NYC Dept. of Finance Assessment Roll
More zoning information: CITI Zoning Guide

Our vacant lot is 701 Caton Avenue. The Block-Lot numbers are 5321-64, information which we can use to get more information, such as the owner of the property, from city databases such as the Department of Buildings.


That’s the basics! You can play around with different layers to produce different thematic maps, zoom in and out, and so on.

Have fun!


Follow-up

There was some additional discussion in the Kensington blog post which sparked me to write this. In particular, comparison was made to PropertyShark, a commercial service that offers similar mapping features with free registration. I’m also registered with PropertyShark. I hardly ever use it.

  • I’ve only found a couple of maps that PropertyShark generates that OASIS doesn’t provide. One nice thing that you can get from PropertyShark, but not OASIS, is a map with street addresses overlaid onto it.
  • PropertyShark retains Copyright for everything you get through them. They place restrictions on how you can use and reuse the information, even though they’re based on largely the same public information sources as OASIS. Since I’m often posting the maps I create to Flickr and using then on my blog, it’s important to me that the maps be unrestricted.
  • PropertyShark requires registration. OASIS does not.

Resource: NYC Stewardship Mapping and Assessment Project

STEW-MAP (the Stewardship Mapping and Assessment Project) is New York City’s first ever map of the more than 5,000 civic environmental groups working in our amazing city.

The first phase of STEW-MAP is a survey for organizations to self-identify themselves and their work in environmental stewardship:

If you are a gardener, a park advocate, a dog walker, a beach cleaner, a kayaker, an environmentalist, an educator, or a community organizer – we need your help in putting your group on the map! …

Please complete [a] brief online form [ENGLISH] [ESPAÑOL] in order to be a part of this new effort.

A dozen different citywide greening groups and 20 other organizations are working together with researchers from the US Forest Service and Columbia University to develop this project.

The assessment will ask you questions about your organization’s mission, size, capacity, geographic areas of interest and partner organizations. Your efforts will result in a series of publicly-accessible, citywide Stewardship Maps and will help inform the development of citywide, participatory Stewardship Roundtables.

The assessment should take approximately 15 minutes to complete. If at any time you have any questions regarding the assessment or the overall STEW-Map project please feel free to contact the project researchers, Dr. Dana R. Fisher from Columbia University’s Department of Sociology and Erika S. Svendsen of the US Forest Service at the project’s e-mail address: stewmap@columbia.edu.

Although the survey will ask for your name and contact information, all personal identifying information will be substituted with randomly generated identification codes once the survey is
completed. If you feel uncomfortable at any time, feel free to stop the assessment.

If you have any questions or concerns about the study you can contact Dr. Fisher at stewmap@columbia.edu or the Institutional Review Board of Columbia University at 212-870-3585 (IRB Protocol #AAAC3958).

We thank you for your organization’s participation!

It’s interesting to me that the Columbia Department of Sociology is involved in this effort. It would be interesting to collect the involvement and experiences of individuals engaged in local stewardship of their neighborhoods. In this regard, the “organization” language is a bit off-putting. What if I don’t belong to, or speak for, an organization involved in stewardship?

[Note: Be sure to read the comment below from Lindsay Campbell, explaining their focus on groups and organizations in this stage of the project.]

I chose to answer the survey anyway, as an individual, using this blog to represent my “organization.” Although I haven’t used the term much, here is where I address many of the issues associated with stewardship, including:

  • Land use practices
  • Sustainability
  • Recognizing and valuing native flora, fauna, and natural areas
  • Ecological restoration

and so on. I try to enact and influence changes on my little patch of land and my neighborhood, whether in my gardens, for street trees, or open and green space. I hope that I educate and inform others both through my efforts, and by highlighting and promoting work that others are doing. I try to be a steward of the place I’m in.

via Susan Siegel, Executive Director, Flatbush Development Corporation, private correspondence

Resource: Animated Map of Historical Development

Trulia Hindsight is an animated map of homes in the United States from Trulia. The animations use the year the properties were built to show the growth of streets, neighborhoods and cities over time.

The title of this post links to a map covering most of Victorian Flatbush, as well as Kensington. On that map, the years range from 1800 to the present. I can only find one little blip for the year 1800; you can find it if you pause the animation, then drag the year slider one year at a time. Then the map shows nothing until 1895

Trulia uses publicly available data for the year of development. For NYC, these data are notoriously unreliable for specific properties; for example, it shows our house was built in the 1930s, although we know it was built in the early 1900s, most likely 1900. Nevertheless, the data are reasonably valid for showing trends.

I’ll try to get a good screenshot.

Via OuterB.

Resource: Cornell Urban Horticulture Institute

A tip from a commenter on my post about the Liberty Elm Project led me to discover the Urban Horticulture Institute of the Department of Horticulture at Cornell University:

The Urban Horticulture Institute currently consists of two faculty, one technician and 10 graduate students.

Founded in 1980 with the explicit mission of improving the quality of urban life by enhancing the functions of plants within the urban ecosystem, the Institute program integrates plant stress physiology, horticultural science, plant ecology and soil science and applies them to three broad areas of inquiry. They are:

  • The selection, evaluation and propagation of superior plants with improved tolerance of biotic [eg: insects, pathogens] and abiotic [eg: heat, air pollution] stresses, and enhanced functional uses in the disturbed landscape.
  • Developing improved technologies for assessing and ameliorating site limitations to improve plant growth and development.
  • Developing improved transplant technologies to insure the successful establishment of plants in the urban environment.

In addition to training for landscape professionals, their outreach section has a lot of information for motivated non-professionals. In addition to DVDs, books and pre-printed materials, many of their publications for free online. These include:

The last selection describes the advantages of planting trees from bare-root stock, instead of container-brown or balled and burlapped (B&B). This is particularly interesting in light of a report in March that it costs over $1,000 to plant a tree in New York City:

Bare root trees are one-third to one-half less expensive than B&B trees. Because they are so much lighter and many more can fit on the bed of a truck, they are cheaper to ship. Planting a bare root tree costs virtually nothing when done by volunteers with shovels. The cost of planting a B&B tree, by contrast, is markedly higher because the sheer weight of the ball requires machinery and machinery operators to load the tree, unload it, and to get it in the ground.
– Creating the Urban Forest

Links

Urban Horticulture Institute , Department of Horticulture, Cornell University

Resources: Native Alternatives to Invasive Plants

As defined in U.S. Executive Order 13112 (Feb 3, 1999), an “invasive species” is:
1) non-native (or alien) to the ecosystem under consideration and
2) likely to cause economic or environmental harm or harm to human health.

Many, perhaps most (but not all) invasive plants were first introduced by gardeners as ornamental plants. For example, Ailanthus altissima, the Tree of Heaven, was cultivated as a shade tree. This is the “tree that grew in Brooklyn,” and the Brooklyn Botanic Garden even uses its image in its merchandise such as t-shirts and tote bags.

Not every plant which can become invasive is a risk in all areas. It helps to understand the ecological region and regime in which you garden and the threats to nearby natural areas. For example, the map of the Plant Provinces of North America in the BBG book Native Alternatives to Invasive Plants places New York City and Long Island in the province of Eastern Deciduous Forests rather than Coastal Plain Forests. Yet Long Island was built from millenia of glacial deposits; the area south of the southern terminal moraine – including most of Brooklyn – has more in common with coastal outwash plains than upland forests. Similarly, Brooklyn’s proximity to the ocean and the Gulf Stream moderates our temperatures compared to, say, the Bronx, the only borough on the mainland; our climate is a blend of Mid-Atlantic and New England as gardening goes.

Some states have taken the lead in making it illegal to sell, purchase, propagate or plant those species known to be invasive. Some gardeners, and nurseries, label such strategies “eco-fascism” and worse. I would support such legislation in New York, which has not yet joined the ranks of these states.

However, legislation should not be the sole strategy. Education must be a primary strategy. As gardeners, we can learn about the natural areas around us and the threats to them. We can avoid purchasing, propagating, planting or recommending plants known to be invasive. We can learn about alternative non-invasive or native choices for plants in our gardens. And we can educate others about these issues and possible solutions.

Mid-Atlantic

Kick the Invasive Exotic Gardening Habit with Great Native Plant Alternatives
National Arboretum

New England

Native Alternatives to Invasive Plants
University of Massachusetts at Boston
via Invasive Species Weblog

General

Native Alternatives to Invasive Plants (Excerpts from book)
Brooklyn Botanic Garden

Links

Resource: Project BudBurst, another Citizen Science project

Yet another Citizen Science resource on the Web, this one can be embraced by all gardeners:

Join us this spring in collecting important climate change data on the timing of leafing and flowering of trees and flowers in your area through Project BudBurst. This national citizen science field campaign targets native tree and flower species across the country. By recording the timing of the leafing and flowering of native species each year, scientists can learn about the prevailing climatic characteristics in a region over time. With your help, we will be compiling valuable environmental information that can be compared to historical records to illustrate the effects of climate change.

I love the subtitle on the home page:

A National Phenology Network Field Campaign for Citizen Scientists

Even if you don’t plan to contribute your own observations, there’s lots of information available on the site. No maps or other data posted yet, since this is just getting started. There’s some good introductory information, and special materials for students and teachers.

Phenology is the study of the timing of life cycle events in plants and animals. In other words, studying the environment to figure out how animals know when it is time to hibernate, and what ‘calendar’ or ‘clock’ plants use to begin flowering, leafing or reproducing.

Phenology is literally “the science of appearance.” Scientists who study phenology – phenologists — are interested in the timing of specific biological events (such as flowering, migration, and reproduction) in relation to changes in season and climate. Seasonal and climatic changes are some of the non-living or abiotic components of the environment that impact the living or biotic components. Seasonal changes can include variations in day length, temperature, and rain or snowfall. In short, phenologists attempt to learn more about the abiotic factors that plants and animals respond to.

What is Phenology?

via Old House Gardens Newsletter #60, April 2007.

Related Posts

Project BudBurst

Links

Project BudBurst

Events and Resources: Hanami and more at the Brooklyn Botanic Garden

Flower Detail, Prunus “Okame”
Cherry Blossoms

Gowanus Lounge noted an article on New Yorkology about the first cherry tree to bloom this Spring at the Brooklyn Botanic Garden, more than a week before Hanami, the cherry-viewing season, officially begins this weekend. I saw that tree in bloom when I visited on Forsythia Day. I didn’t get to write up that visit yet; the least I can do is pump up this tree’s 15 minutes of fame. (It’s not as impressive as the cherry tree which bloomed in December, which I didn’t get to see.)

Before you visit the Brooklyn Botanic Garden, you should visit their Web site. Their Plants in Bloom page shows you what happens where and when: not just right now, but for every month of the year. Some areas are of particular interest only at certain times of the year, and knowing whether or not they’re worth a peek in advance of your trip can help you plan your visit. For example, Daffodil Hill was not quite peaking when I was there on Sunday, while the Bluebell Wood was showing only winter-damaged foliage. Of course, much of the garden has lots of things even when they’re not in bloom, but this still is a good indicator of what you might expect to see.

But this time of year, the hype is all about the Cherry Trees. Hanami runs from this Saturday, April 7, through Sunday, May 6. The big event is the annual Sakura Matsuri, the Cherry Blossom Festival. This year it’s the end of April, Saturday and Sunday, April 28 and 29. There’s always an impossible number of events highlighting many different aspects of traditional Japanese culture, including music, dance, theater, crafts, and more.

Leading up to and during Hanami, BBG maintains a special map on their Web site, just for the cherries.

BBG’s CherryWatch (Hanami) Blossom Status Map showing the single specimen of Prunus “Okame” in bloom at the time of my visit.
Blossom Status Map, Brooklyn Botanic Garden

Each cherry tree on the map is linked to a popup summary of the plant, as shown here, which links to a detail page describing the specific variety. Here’s what BBG has to say about ‘Okame’:

This hybrid of the Formosan and Fuji cherries was introduced to Europe in 1947 from Japan by Captain Collingwood Ingram. Its deep carmine-rose buds open to lighter tinted flowers before leaves appear. This small- to medium-sized tree is excellent for small gardens and is also showy in fall, with orange-red leaves. This variety is recommended by the Garden Club of America’s book, Plants That Merit Attention.
Prunus ‘Okame’

And here it is: the single flowering cherry tree.

Lone Flowering Cherry and my Doppelganger

The other photographer in the photo seemed to be everywhere I was on Sunday, so I had to shoot around him a lot. For example, he was standing next to me (or I next to him) when I took this upward-looking shot against the overcast sky:

Cherry Blossoms

Finally, here’s a different shot of the same cluster of flowers at the top of this post. I like the background of the out-of-focus branches in this one; it works like an oversized mat in a picture frame. I think I’m going to process this one a bit and try to lighten it up without losing the mood.

Cherry Blossoms

Links

Flowering Cherries at BBG

Resource: Garden-Based Learning

The Garden-Based Learning Program develops projects, activities, and other materials, as well as gardening content- and youth development-oriented support. Many of our materials can be found on-line at this site, or through the Cornell Cooperative Extension Media Services Resource Center.
About page, Garden-Based Learning

The Garden-Based Learning Program is based in the Department of Horticulture at Cornell University. We partner with faculty and staff in other departments at Cornell, educators in county Cooperative Extension associations, and with other agencies throughout the U.S.

Our garden-based learning team encompasses a small group of county and campus educators that meet twice each year to brainstorm new projects, share resources, and plan conference and inservices.

via Librarian’s Internet Index

New Web Resource: Global Restoration Network (GRN)

Today the Society for Ecological Restoration (SER) announced the launch of a new Web resource, the Global Restoration Network (GRN):

A unique industry resource, the interactive website is rich with data, information, expertise and the latest techniques and innovations in restoration. Freely accessible to anyone in the world who has an Internet connection, users can now find the exact information they need to research, implement and improve their ecological restoration projects in three clicks or less.
– SER Press Release

This will be bear watching to see how objective it is. One of their funding sources is Chevron.

The Global Restoration Network (GRN) – a project of the Society for Ecological Restoration International – offers the field of ecological restoration a new database and web-based portal to trustworthy and hard-to-find information on all aspects of restoration, from historic ecosystems and recent causes of degradation to in-depth case studies and proven restoration techniques. The overriding mission of the GRN is to link restoration projects, research, and practitioners in order to foster the creative exchange of experience, vision and expertise.

The field of ecological restoration is currently experiencing an explosion of ideas and practices as the number of experts and practitioners increases, and more and more restoration projects are being undertaken around the world. And now that the field has been established, there is great need for a single, comprehensive source of information for governments, individuals, corporations and nonprofit organizations on the current state of degradation and the best restorative practices.

The GRN is fast becoming the central hub for ecological restoration – a vital resource for policymakers, professionals and community stakeholders alike: whether researching options for ecosystem restoration, writing a project proposal, or looking for educational programs and funding. Perhaps the most exciting feature of the GRN is the innovative Database where you can make a specific query and find restoration case studies and annotated links to a wide variety of relevant resources including experts, organizations and literature.
GRN Home Page

Web Resource: New York Metropolitan Flora Project (NYMF)

Updated, 2013-08-25: Corrected links.


Brooklyn Botanic Garden‘s New York Metropolitan Flora Project (NYMF) documents the distribution of woody plant species among 25 counties in New York, New Jersey, and Connecticut within a 50-mile radius around New York City. Tools available online include:

While most of the botanical community concentrates on tracking the threats to biodiversity in the tropics, scientists at the Brooklyn Botanic Garden are undertaking the most comprehensive study ever of the plant biodiversity in metropolitan New York. Studying the vegetation changes in highly populated areas is critical to understanding the future of life in our rapidly urbanizing world. …
Understanding the urban landscape is critical in our rapidly urbanizing world. Findings of BBG’s Metropolitan Flora Project serve as vital references for those involved in environmental efforts, from preserving rare plants, to planning parks and greenways, to repairing degraded habitats, to designing home gardens in which native plant communities are preserved or restored.

Links

Brooklyn Botanic Garden: New York Metropolitan Flora Project