Celebrating 50 Years of Carbon Dioxide (Measurement)

Monthly Mean CO2 for the Past 50 Years. Credit: NOAA
Mauna Loa, Hawaii Monthly Mean CO2 for the Past 50 Years

This simple graph of the Mauna Loa Carbon Dioxide Record documents a 0.53 percent or two parts per million per year increase in atmospheric carbon dioxide since 1958. This gas alone is responsible for 63 percent of the warming attributable to all greenhouse gases according to NOAA’s Earth System Research Lab.

Fifty years ago the U.S. Weather Bureau, predecessor of NOAA’s National Weather Service, helped sponsor a young scientist from the Scripps Institution of Oceanography to begin tracking carbon dioxide in Earth’s atmosphere at two of the planet’s most remote and pristine sites: the South Pole and the summit of the Mauna Loa volcano in Hawaii. This week NOAA, Scripps, the World Meteorological Organization, and other organizations will celebrate the half-century anniversary of the global record of carbon dioxide in Earth’s atmosphere—often referred to as the “Keeling Curve” in honor of that young scientist, Charles David Keeling.
NOAA Celebrates 50-Year Carbon Dioxide Record

NOAA’s Mauna Loa, Hawaii CO2 Monitoring Station. Credit: NOAANOAA's Mauna Loa, Hawaii CO2 Monitoring Station

Carbon dioxide is the most important of the greenhouse gases produced by humans and very likely responsible for the observed rise in global average temperatures since the mid-20th century. The Mauna Loa and South Pole data were the first to show the rate of CO2 buildup in the atmosphere. In 1974, NOAA began tracking greenhouse gases worldwide and continued global observations as the planet warmed rapidly over the past few decades.

Links

Mauna Loa Carbon Dioxide Record
Mauna Loa Observatories
Earth System Research Lab

Time to take the umbrella down

The National Weather Service has issued several weather advisories for NYC tomorrow, as Hurricane Noel passes off-shore:

New York City will feel the remnants of Hurricane Noel this weekend, starting late Friday, November 2. High winds will blow into the city and be especially powerful between 6 a.m. and 6 p.m. on Saturday, November 3. During this time, sustained wind speeds will be 30-35 mph, and gusts may reach 45-55 mph.
Wind Advisory

The National Weather Service has also issued a Coastal Flood Advisory and High Surf Advisory for Saturday into Sunday morning.

High winds can cause downed trees and power lines, flying debris and building collapses, which may lead to power outages, transportation disruptions, damage to buildings and vehicles, and serious injury. New Yorkers should secure objects that are outside their homes.

Tornado Damage in Prospect Park South, Caton Park and Beverley Square West

Update 2007.08.09: The National Weather Service says that this was the strongest tornado on record to hit New York City.

Evening update: By the afternoon, the National Weather Service (NWS) confirmed that there had been an EF2 tornado, but only in the Bay Ridge section of Brooklyn. They also reported that it traveled northeast, which would have placed it in the path of Sunset Park, Kensington, and Flatbush.

Update 16:30 EDT: I’ve got the Flickr set up, and I’m uploading the remainder of the photos as I type.


Totalled. This was on Rugby Road, north of Church Avenue in Caton Park.
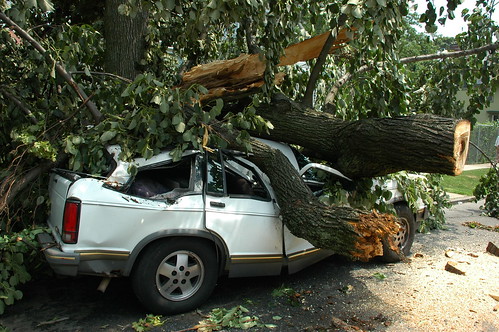
Totalled

I just got back a half-hour ago from my tornado walking tour of my neighborhood, Beverley Square West, the adjoining Prospect Park South Historic District, and Caton Park. I’m home today because none of the subways were running this morning, and our local line, the B/Q train, is down due to trees on the tracks near the Church Avenue station, around the corner from Prospect Park South, which sustained heavy damage.

Cortelyou Road Station (Q Line), closed
Cortelyou Road Station, Closed

Chainsaws will be serenading us for the next several days. I have lots of photos to upload, once I can clear enough space on my hard drive to accommodate them. I should have plenty by the end of the day, so check back later.

The National Weather Service hasn’t made the determination, but from the reports, and from the damage I saw, I think it must have been a tornado that tore through Brooklyn this morning. When I went out this morning, the local news channels were only covering the neighborhood of Bay Ridge. But later reports include Sunset Park and Kensington. There’s still been no mention of Flatbush on the news, but these neighborhoods form a rough path through central Brooklyn. There’s a track of damage through Brooklyn, not just localized damage, which is just what one would expect to see from a tornado.

Marlborough Road, south of Albemarle Road. Note the two trunks left standing in front of the house on the right; they were both snapped off.
Marlborough Road, south of Albemarle Road

The damage I saw, especially in Prospect Park South, just looked odd. It wasn’t any one thing. There were trees, such as the one at the top of this post, which clearly had problems before they were blown down. Those we would expect to be fall in heavy winds. But there were many trees with clear, clean wood, with no signs of disease or other problems.

Twisted and split limb of Norway maple, 125 Argyle Road

Every kind of tree was affected. Most of the smaller trees were simply blown over, snapped at the root flare, separated from the roots. Some of the larger trees were also toppled, their roots pushing up sidewalks. But many were snapped off at the trunk, or their upper limbs and branches seemed to have been shredded off. I saw large limbs whose damage could only have been caused by twisting. Upper limbs of trees didn’t just fall onto rooftops, they were blown up onto them.

Parks Department beginning to remove a toppled street tree in Beverley Square West.


Parks Department beginning to remove a toppled street tree.


[bit.ly]

Links

An EF-2 Tornado Strikes Brooklyn on the Central New York Weather Blog of WKTV in upstate New York has some great radar images and the complete text of the National Weather Service’s statement confirming the tornado.
August 16, Brooklyn Eagle: While Bay Ridge Captured Attention, Flatbush Areas Also Suffered from Brooklyn Tornado
August 10, Brooklyn Eagle: The Path of The Brooklyn Twister; Heroic Efforts Help Affected Brooklyn Areas Recover from Tornado Damage includes an excellent map of the path of the tornado

A Tree Blows Down in Brooklyn, photos of damage in Bay Ridge, Brooklyn Row House blog

NYC Hazards: Tornadoes, NYC Office of Emergency Management (OEM)

Map: Brooklyn Coastal Storm Impact Zones

[Updated 2007.04.17 21:40 EDT: Removed bad link in title.]

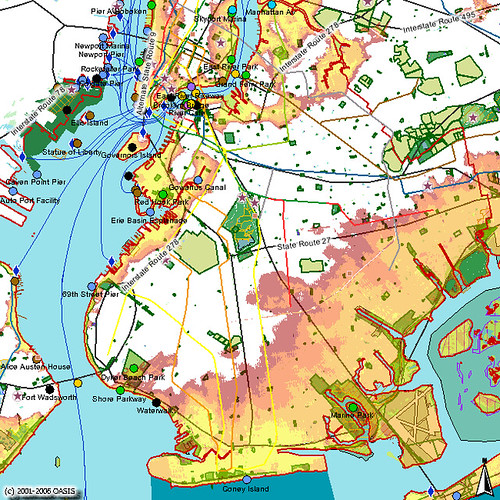
Brooklyn Category 1-4 Coastal Storm Impact Zones

This maps shows Brooklyn impact zones for Category 1 through 4 coastal storms. OASIS recently added this layer to their already invaluable Web mapping service.

You can view the live map, where you can zoom in or out, select different layers and labels, and see how your neighborhood is affected.


Happy Groundhog Day!

Fluffy, the mascot for my team at workHappy Imbolog to all my fellow gardeners!

Groundhog Day, celebrated on February 2, has its roots in an ancient Celtic celebration called Imbolog [Wikipedia: Imbolc]. The date is one of the four cross-quarter days of the year, the midpoints between the spring and fall equinoxes and the summer and winter solstice.
NOBLE Web: Groundhog Day

The groundhog, Marmota monax, also known as a woodchuck, or whistlepig, is the largest species of marmot in the world.

Imbolog, marking the midpoint between the winter solstice and the spring equinox, was the most important of the cross-quarter days. In a society dependent on agriculture and therefore on the weather, this was a time to celebrate having made it halfway through winter. The superstition arose that if the weather was fair on Imbolog, the second half of the winterwould be cold and stormy, but if the weather was cold and overcast or stormy, the second half of the winter would be mild.

In early Christian times, February 2 was celebrated as Candlemas, but the earlier Imbolog superstitions persisted. In medieval Scotland, for example, they said, “If Candlemas be bright and clear, there’ll be two winters in the year” and in England, they said, “If Candlemas be sunny and warm, ye may mend your mittens and look for a storm.”

The Romans learned these traditional beliefs from the Scottish Celts, and brought them to the area that was to become Germany, where they became a part of the folk culture. German immigrants brought these beliefs with them to Pennsylvania, where the tradition of predicting the weather became centered around the woodchuck or groundhog. The town of Punxsutawney, Pennsylvania, has an annual celebration centering around the activity of the groundhog “Punxsutawney Phil.”
NOBLE Web: Groundhog Day, via Librarians’ Internet Index

Weather News: Deep Thunder

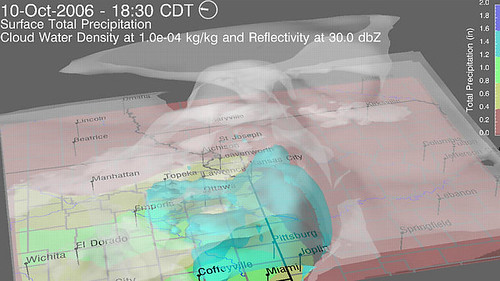
DeepThunder Prediction for Kansas City, MO

Deep Thunder predicted cloud formation, rainfall, and accumulated precipitation for the Kansas City, MO area for 18:30 CDT tonight. This is one snapshot of an animated display with predictions at 30-minute intervals.
Credit: IBM, Deep Thunder project, forecast for Kansas, Missouri, Nebraska and Iowa.

If you garden within the greater metropolitan areas of Kansas City, Missouri, Atlanta, Georgia or Miami, Florida, you’ll want to check out Deep Thunder, a free, experimental, precision weather forecasting service offered on the Web by IBM. For example, from the image above, Deep Thunder is predicting thunderstorms around dinner-time tonight for the area around Miami, KS and Joplin, MO. Let me know how it goes!

The blurb from IBM uses “business” language like “weather-sensitive operations” and “resource allocation, scheduling, and routing”. I’ll try to translate from “business” to “garden”:

Improving the effectiveness of a customer’s weather-sensitive operations [watering, planting, weeding, mowing, raking … basically, anything outdoors] is not actually about the weather [Try planting bulbs in sleet and see if you still feel that way]. Rather, it is about optimizing business processes [eg: watering, planting, weeding, harvesting, mowing, etc] such as resource allocation [Who wants to mow/rake/shovel?! Hello? Anyone? …], scheduling [Should I water now, or is it going to rain later? Should I rake the leaves, or will the wind blow them all over anyway?], and routing [can I get from the house to the garden and back without getting soaked, frostbitten, sunburned …], which are constrained by specific weather events [You’re a gardener, right? I don’t need to spell this out for you!]. For example, local and state governments agencies need weather information for routine emergency [frost hit the tomatoes] planning for snow (removal, crew deployment [you, your significant other, immediate family members]), repair of downed power lines [broken tree limbs, bean trellises, etc] due to severe winds, and evacuation [pre-emptive harvesting] from areas of potential flooding. …

And so on for several more paragraphs. There’s one mention of “agriculture” as a potential “application,” but that’s all the mention we get.

“Sounds great!” you say? “How can I play?!” Here’s how:

  1. Go to the Deep Thunder page.
  2. Click the Try It Now link. This will open a new browser window (or tab, if you’re using Firefox).
  3. Read (or not) the “Services Use Agreement.” Click the [I Agree] button.
  4. You’ll get a map that looks like this:
    DeepThunder Menu Map
  5. Click inside the inner or outer box for detailed predictions, maps, and animations.

Thanks to Dr. Dobb’s Journal (yes, I am a geek) for reminding me of this.

News, August 1, 2006: NASA Earth Observatory Maps NYC’s Heat Island, Block by Block

Timely enough, given the record temperatures we’re experiencing this week. Tomorrow’s forecast has been “upgraded” from what I reported yesterday: the THI may reach 117F tomorrow.

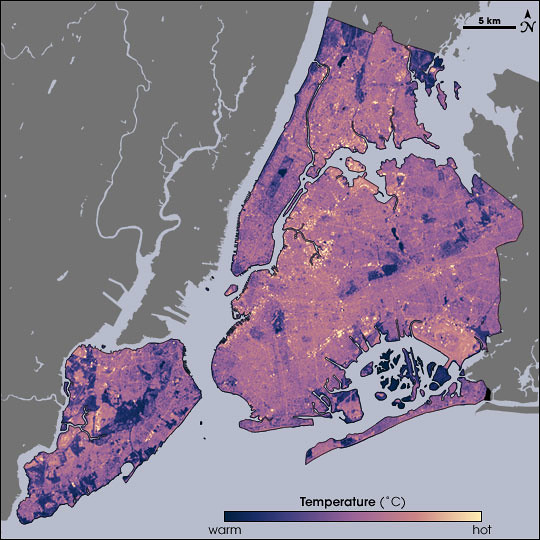
Temperatures in New York City as measured by Landsat on August 14, 2002, at 10:30am, during a heat wave. Cooler temperatures are blue, hotter are yellow.
Source: NASA Earth Observatory. Map by Robert Simmon, using data from the Landsat Program.
NASA Map of Surface Temperatures in New York City, 2002-08-14

Temperatures in New York City as measured by Landsat on August 14, 2002, at 10:30am, during a heat wave. Cooler temperatures are blue, hotter are yellow.
Source: NASA Earth Observatory. Map by Robert Simmon, using data from the Landsat Program.
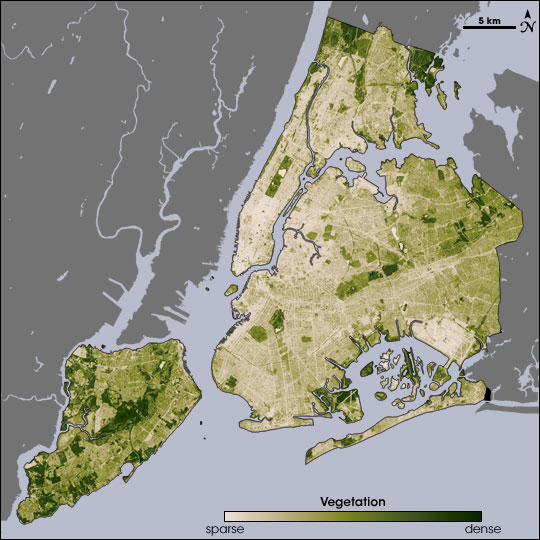
NASA Map of Surface Vegetation in New York City

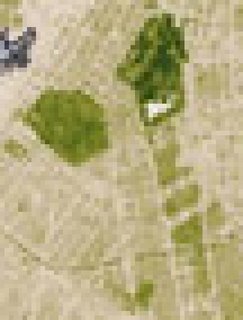
The ability of vegetation to moderate urban temperatures is graphically demonstrated in these paired images from NASA’s Earth Observatory. The spatial resolution of these images is 60 meters per pixel. At that scale, I can just about make out the block where I garden:

Closeup of the vegetation map, centered on central Brooklyn. The green area at the left is Greenwood Cemetery. Prospect Park is the dark green area at the top; the white area within it is Prospect Lake.

Below the park, to the south, Victorian Flatbush, with its tree-lined streets, detached wood frame houses, and front lawns, spreads out as a series of olive green areas. The beige areas in-between the olive are rowhouses and apartment buildings. You can even make out a curving green line across the southern end of this area: That’s the old LIRR right-of-way, long abandoned, and overgrown with trees.

NASA has just published a report on urban heat islands highlighting the research of Stuart Gaffin, an associate research scientist with the Earth Institute at Columbia University in New York City, and his colleagues:

In the summer of 2002, Gaffin and his colleagues used satellite temperature data, city-wide land cover maps, and weather data, along with a regional climate model to identify the best strategies for cooling the city. The team estimated how much cooling the city could achieve by planting trees, replacing dark surfaces with lighter ones, and installing vegetation-covered “green roofs.”
The team studied the city as a whole, as well as six “hotspot” areas—including parts of Manhattan, the Bronx, Queens, and Brooklyn—where air temperatures near the ground were higher than the city-wide average. Each area was serviced by Con Edison, the local power company, so the scientists could compare electricity use. Each area also had available space so that the mitigation strategies the team considered could be modeled in the study and potentially implemented later on.
August 14 fell on one of the hottest heat wave days in New York’s summer of 2002, making it a good day to take the city’s temperature. Measuring the temperature of every last sidewalk, street, parking lot, roof, garden, and grassy area in an entire city isn’t easily done from the ground, so the researchers relied on NASA to take the city’s temperature from the sky. NASA’s Landsat Enhanced Thematic Mapper collected thermal infrared satellite data. …
Beating the Heat in the World’s Big Cities

Related posts

Urban Forestry